![]()

This is a chart of populations from The Emigrant's Guide or Pocket Geography of the Western States and Territories, published in 1819. More detailed numbers from the 1800 census - with the same caveats noted above - are here. |
![]()
![]()
Some Area and Population Statistics, 2000 Census
| Sorted by Area, and Rank in Size, | |||||
| County | Area | Population | Density | Rank in Size | Density Rank |
|---|---|---|---|---|---|
| Gallatin | 98.8 | 7,870 | 79.6 | 120 | 43 |
| Carroll | 130.0 | 10,155 | 78.0 | 118 | 45 |
| Trimble | 148.8 | 8,125 | 54.5 | 117 | 63 |
| Campbell | 151.5 | 88,616 | 584.7 | 116 | 4 |
| Kenton | 161.9 | 151,464 | 935.1 | 114 | 2 |
| Bracken | 203.2 | 8,279 | 40.7 | 100 | 82 |
| Mason | 241.1 | 16,800 | 69.6 | 89 | 50 |
| Boone | 246.2 | 85,991 | 349.1 | 87 | 5 |
| Grant | 259.9 | 22,384 | 86.1 | 79 | 33 |
| Pendleton | 280.5 | 14,390 | 51.2 | 74 | 69 |
| Owen | 352.1 | 10,547 | 29.9 | 44 | 111 |
Sorted by Population Density and Density Ranking |
|||||
| County | Area | Population | Density | Rank in Size | Density Rank |
| Owen | 352.1 | 9,547 | 29.9 | 44 | 111 |
| Bracken | 203.2 | 8,279 | 40.7 | 100 | 82 |
| Pendleton | 280.5 | 14,390 | 51.2 | 74 | 69 |
| Trimble | 148.8 | 8,125 | 54.5 | 117 | 63 |
| Mason | 241.1 | 16,800 | 69.6 | 89 | 50 |
| Carroll | 130.0 | 10,155 | 78.0 | 118 | 45 |
| Gallatin | 98.8 | 7,870 | 79.6 | 120 | 43 |
| Grant | 259.9 | 22,384 | 86.1 | 79 | 30 |
| Boone | 246.2 | 85,991 | 349.1 | 87 | 5 |
| Campbell | 151.5 | 88,616 | 584.7 | 116 | 4 |
| Kenton | 161.9 | 151,464 | 935.1 | 114 | 2 |
Northern Kentucky counties are among the smallest in Kentucky. The state's three
largest counties (Pike, 786; Christian, 726; & Pulaski, 630) total 2142 square miles, while the
eleven counties of Northern Kentucky Views only total 2,274. On the other hand, the population density
is higher. The median county density is 65.
(The density numbers are people per square mile; the rankings are the positions among Kentucky's
120 counties; the population figures are from the 2000 census. Statewide data is
at this site.)
A table showing the counties in order of their creation is here.
Map showing percent of slave population in 1860 census.
![]()

College Graduation Trends, 1960 - 2000
The Annual Report of the Kentucky Superintendent of Public Education from 1858 had
a number of interesting statistics. You can find'em
here and here
Similar statistics from the 1899-1900 school year are here, here, and here.
![]()

Cincinnati Commercial, January 30, 1869
| The National Weather Service's web site gives you record snowfall numbers, as recorded at CVG. | |
Number of School Districts by county in 1858, here. Also from 1858 is the accompanying data showing property values owned and the number of children. It's here. |
Census of Northern Kentucky's Paupers in Almshouses, 1910, here. |
| In 1842 the State set tolls for traveling the turnpikes of Kentucky. | Number of fishing and hunting licenses issued by county in 1948. |
| Populations of Kentucky cities in the 1820 census. Only three of them are in Northern Kentucky, and they're not the three you think. Covington is 7th. | Detailed population statistics from 1910, here. |
| A list of all seventy-five - that's 75 - different, locally owned banks in Northern Kentucky, in 1908, by county, can be found here. (pdf) | A few statistics on highway construction progress from 1911, here. |
Attendance from Northern Kentucky Counties at UK, Eastern, and Western. In 1912-13. Here. |
The 1853-54 count of hogs in various Northern Kentucky counties is here. |
| The 1910 Farm Census counted farm animals, by county. | The 1910 Farm Census also counted types of crops, by county. |
![]()
Northern Kentucky didn't exactly embrace Abraham Lincoln. The results from 1860 are here, and 1864 here. |
Detailed Presidential voting statistics from all 11 counties in Northern Kentucky Views are
here.
The numbers from each individual county are on the Links and Miscellany pages of the respective counties.
![]()
![]()
Postage Accruing at various Kentucky Post Offices in 1905.
May's Lick had $187.91, but Covington only $59.06? Curious.
![]()
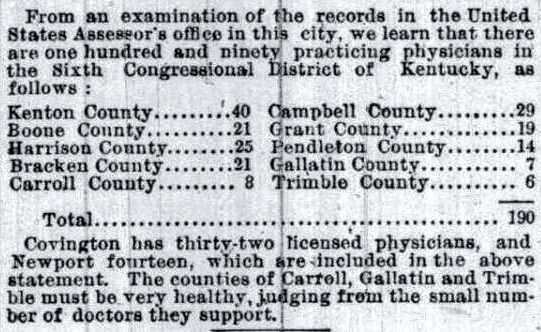
Mortality Statistics for Covington and Newport, from 1909 |
||
| By Age | By Cause | By Nationality |
![]()
 |
 |
 |
| By City | By Make | By County |
|
These are all the automobiles registered with the State of Kentucky from June 14, 1910 until roughly the same day in 1911. It's the first year Kentucky registered automobiles; so these may not be THE first cars in the county, but they are the first registered cars. For each individual county's registrants, see that county's Links & Miscellany page, or, try these: Boone,
Bracken, Campbell,
Carroll, Grant,
Kenton,
Mason, and
Pendleton. The general statistics on vehicle licensing from 1921 are here. |
||
![]()
 |
 |
|
|
![]()


